
Case Studies · District demographics & GIS reconciliation
The new CA-08 crossed five counties, and one number had to be right.
Updated 2026-07-24
When California adopted a new configuration for the 8th Congressional District under AB 604 and Proposition 50, a congressional office needed a defensible demographic profile of a district that crossed five counties, contained some cities in full, split others between districts, and included unincorporated communities that no city roster would surface. Plavidian reconciled the adopted GIS boundary, Census geography, redistricting data, and official jurisdiction reports into a verified profile: 760,066 residents, 595,508 of voting age, 513,705 citizen voting age, reconciled to the official control total with the source tables' two-person discrepancy disclosed rather than smoothed away.
The outcome
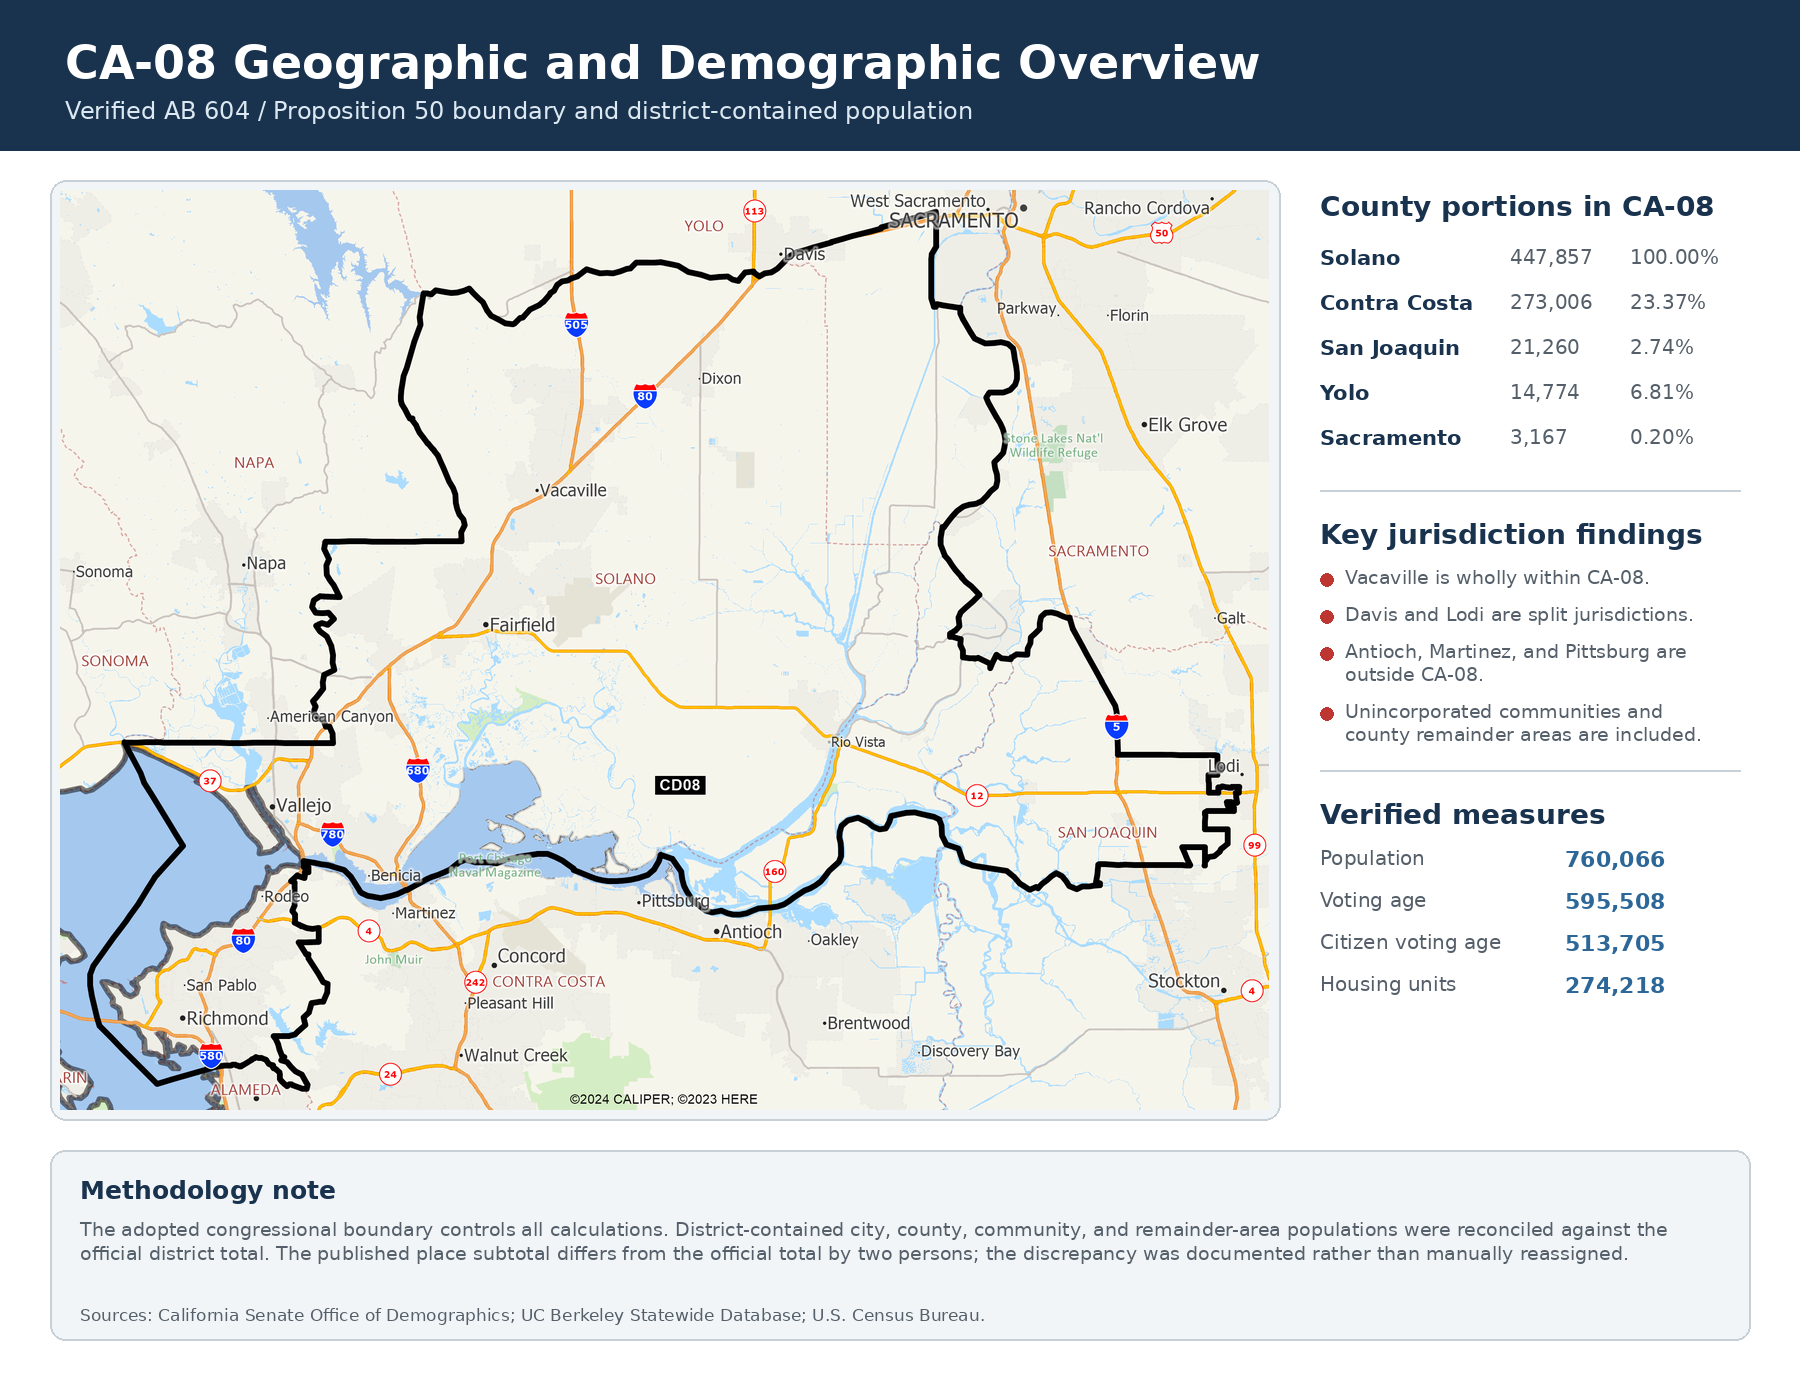
The office received a government-source demographic profile in which every number belongs to the adopted boundary. County portions run from Solano's 447,857 (wholly contained) down to Sacramento's 3,167. Split cities like Davis and Lodi are counted only for their district-contained residents, and unincorporated communities and county remainder areas are kept so no resident disappears from the profile. The jurisdiction table reconciles to the official 760,066 control total, and a separate methodology memorandum lets the analysis be reviewed, repeated, and defended.
- 760,066verified district population, reconciled to the official total
- 513,705citizen voting-age residents, reported separately by design
- 5counties reconciled; only one wholly contained
- ±2person source discrepancy disclosed, not smoothed away
The controlling question
The adopted boundary controls every number
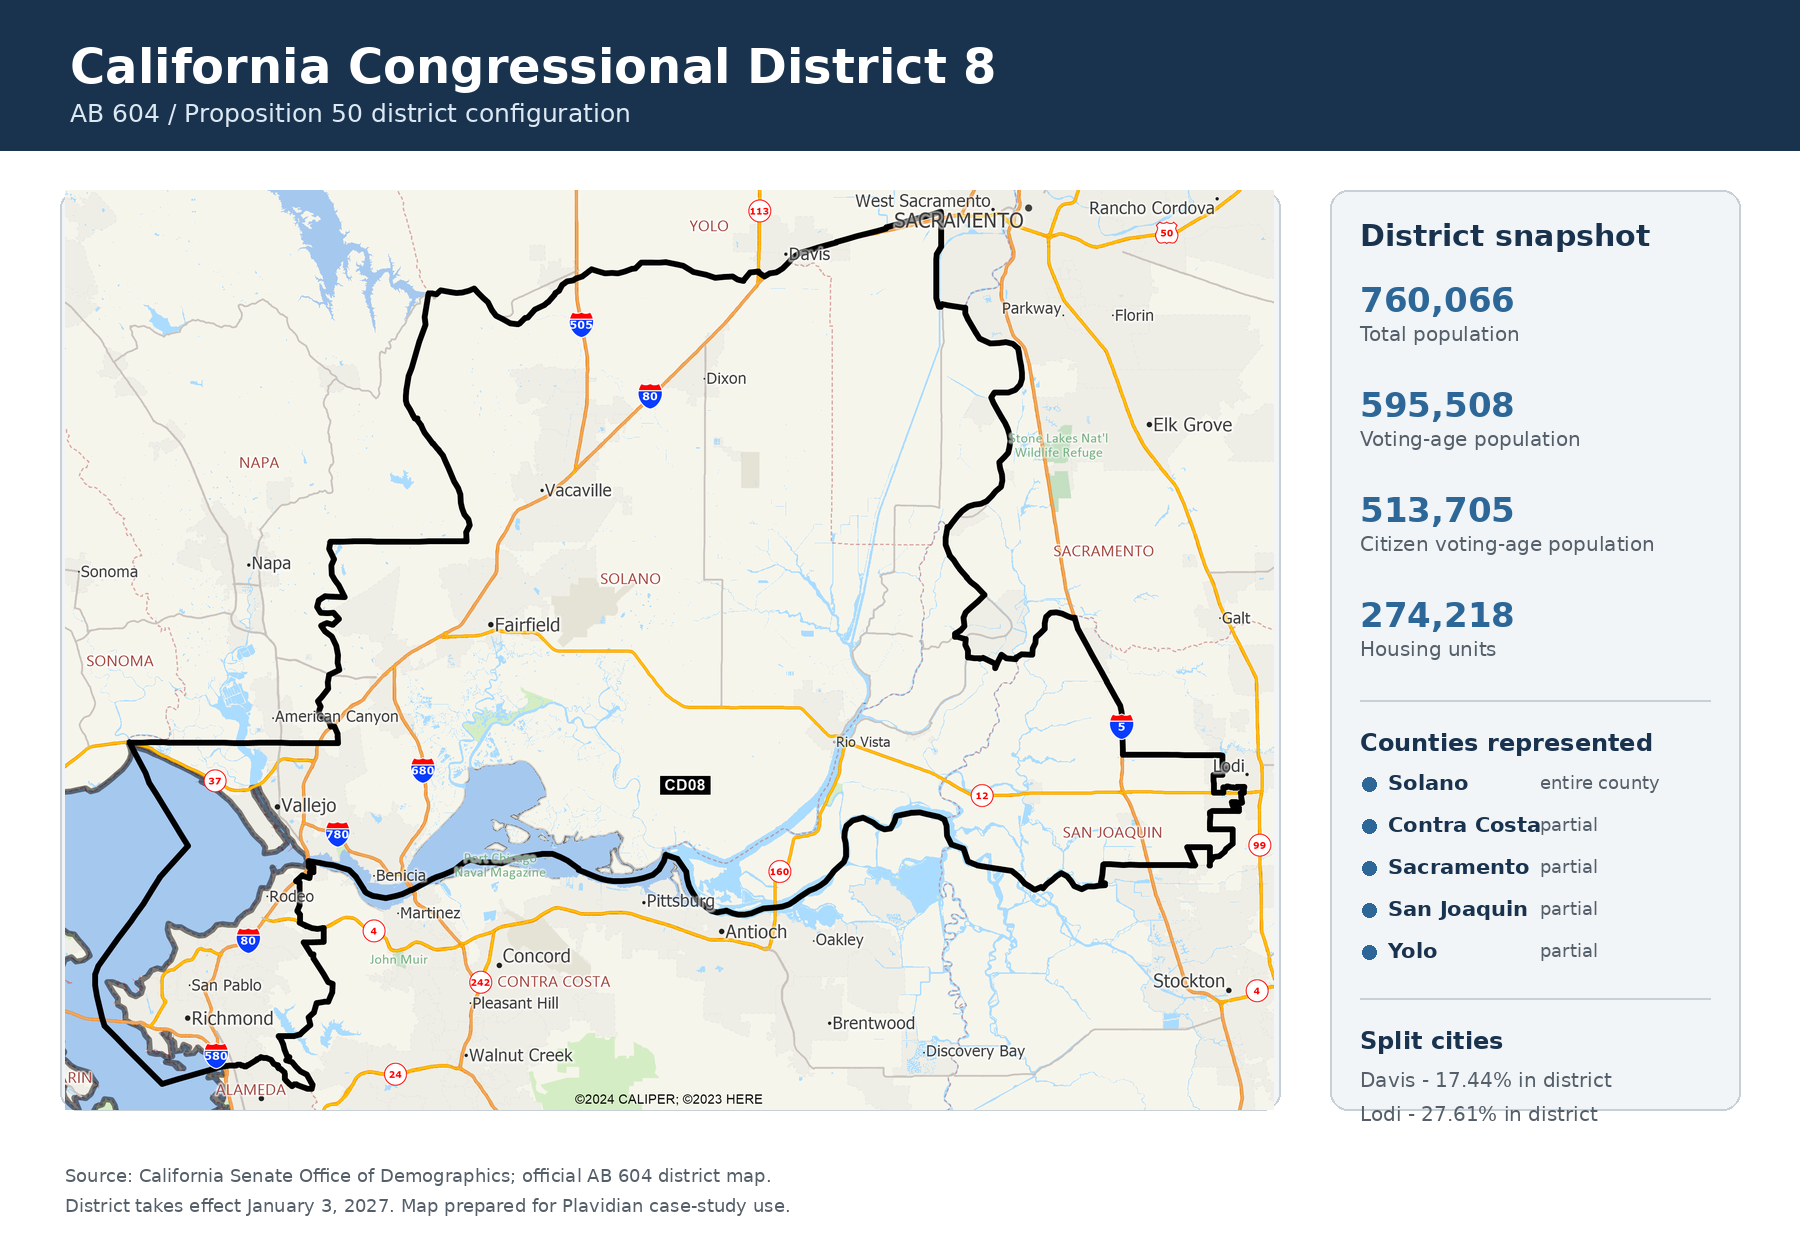
District demographics look like a lookup until the lines move. The adopted CA-08 crossed Contra Costa, Sacramento, San Joaquin, Solano, and Yolo counties, and only Solano was wholly contained. Several cities that seemed geographically or historically associated with the district were not in it; others were split, so using a whole-city total would overstate the population the office actually represents. The governing rule Plavidian set at the start: the adopted district boundary, not a ZIP code, county line, prior configuration, or assumed city list, controls every calculation.
That rule corrected real assumptions. Vacaville was verified as wholly within the district. Davis and Lodi were verified as split, contributing only their district-contained portions. Antioch, Martinez, and Pittsburg, plausible inclusions on a casual map read, were verified as outside the district entirely.
The reconciliation
Five sources, one control total
No single dataset answers a redistricting question. The official district shapefile defined the legal boundary; Census TIGER/Line and 2020 block geography supplied the population units; Public Law 94-171 redistricting data carried population and race; Statewide Database city-split reports settled municipal containment; and the official district profile supplied the control totals everything had to reconcile against. Plavidian treated district geography as primary and municipal geography as a reporting layer, which is what keeps a split city from being double-counted or a county remainder area from vanishing.
The reconciliation surfaced a two-person difference between the published jurisdiction line items (760,064) and the official district total (760,066). Plavidian disclosed it instead of silently adjusting a component to force agreement: a documented source-table discrepancy is defensible, and an unsupported edit to an official figure is not.
What the numbers are for
Three populations, three different questions
The profile reports total population, voting-age population, and citizen voting-age population separately because they answer different questions: total population drives constituent services, infrastructure, and housing work; voting-age population counts all adults; citizen voting-age population matters for representation and language-access review. Reporting all three, with race and ethnicity at each level where the sources support it, keeps the office from applying one measure to a purpose it was never designed for. A separate methodology memorandum documents the sources, allocation rules, validation steps, and limitations, and states plainly what the report is not: voter registration, turnout, or campaign targeting.
The deliverable
A five-page memo built to be checked
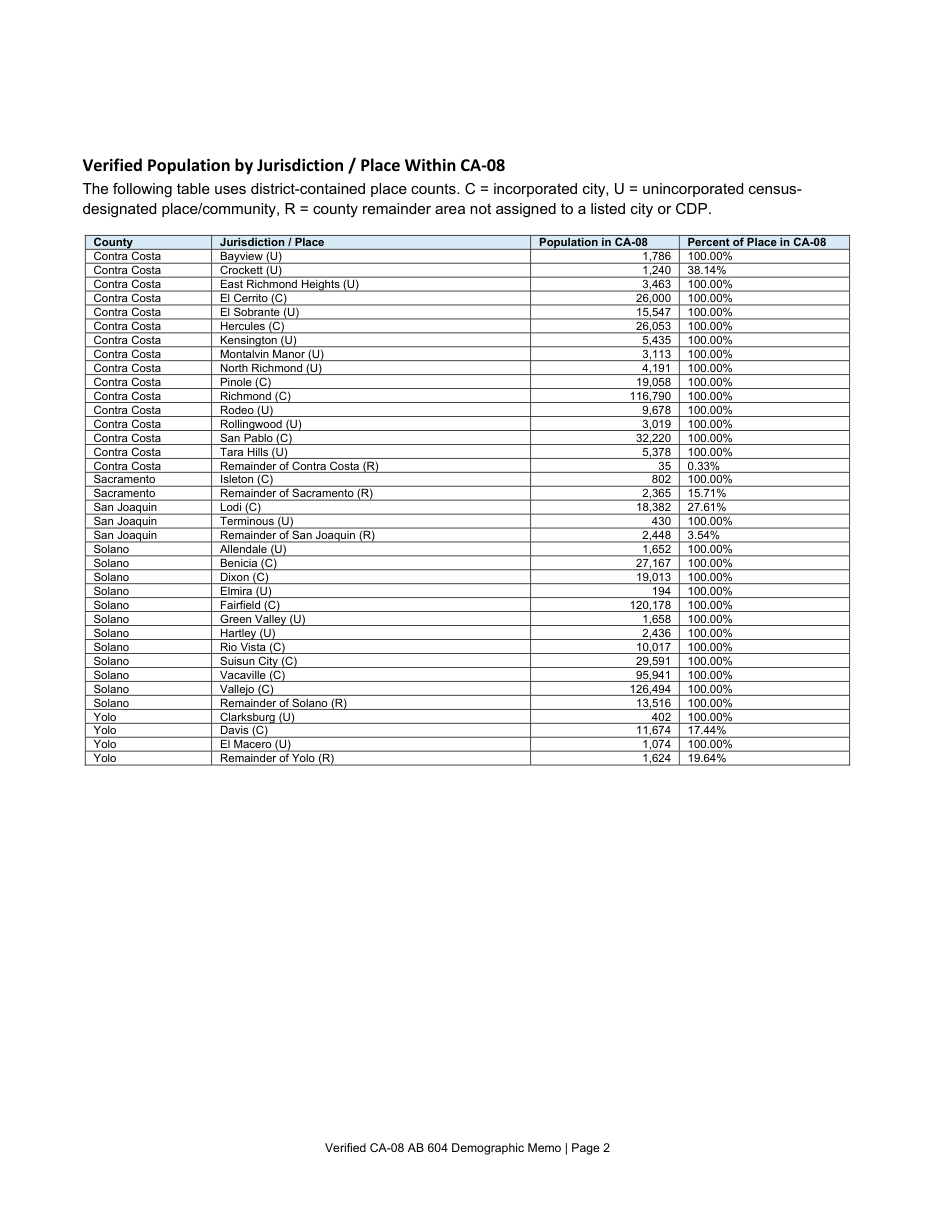
The deliverable is a five-page memorandum, dense by design. The jurisdiction table above lists all 37 district-contained places (incorporated cities, unincorporated communities, and county remainder areas), each with its population and containment percentage, so a staffer can see at a glance that Crockett is 38.14% in the district while El Cerrito is wholly contained. Race and ethnicity are reported at three population levels: total, voting age, and citizen voting age. Every figure names its source (Senate Office of Demographics, the Statewide Database city-splits report, Census PL 94-171), and the memo closes with the full methodology, limitations, and a plain statement of what the report is not for. Nothing in it asks to be taken on faith.
Why it generalizes
The same method works for any custom boundary
The method applies wherever an office or agency needs a defensible profile of a geography that no published table matches: legislative and council districts, school and utility districts, service territories, grant zones, emergency-planning regions. Begin with the controlling legal boundary, integrate the smallest reliable population geography, verify every jurisdiction intersection, and reconcile the result to an authoritative control total. Accurate district demographics depend on verifying that every number belongs to the correct boundary.
A newly configured district is a collection of maps, tables, shapefiles, and split-jurisdiction reports until someone reconciles them. Plavidian turned those sources into a planning resource the office can defend: every jurisdiction verified, every partial city allocated, every resident counted once, and the whole reconciled to the number that controls.
Need district numbers that hold up to scrutiny?
Ask Plavidian to reconcile the adopted boundary, Census geography and official reports into one verified profile before the program is planned.
Related
Political mail, end to end
Guides and services for campaigns, committees and elected offices, from voter data to delivery.
- political mail printing and direct mail services
- campaign mail printing for candidates and PACs
- franked mail for congressional offices
- political mail camera verification (Plavidian Sentry)
- piece-level mail tracking for campaigns (Plavidian Insight)
- voter files, district universes and mailing list targeting
- address list cleanup: standardization and deduplication
- variable-data printing and lettershop services
- USPS Full-Service Intelligent Mail
- planning a winning campaign mailing in 2026
- yard signs and door hangers for political campaigns
- USPS political mail guide: Tag 57, election mail rules
- free postage planning with Mailing Blueprint
- Election HQ: California election mail calendar
Related
Data, addresses and postal optimization
Planning a list before it mails: Mailing Blueprint, address checks, list processing, postage optimization, maps and district data.
- mailing list analysis and postage planning with Mailing Blueprint
- address list cleanup: standardization and deduplication
- CASS address standardization
- NCOALink move update processing
- how to prepare a mailing list
- EDDM or a mailing list: how to choose
- the main direct mail formats and how to choose
- direct mail ideas and campaign examples
- mailing lists and audience targeting
- drop shipment planning and destination entry
- nationwide mailing and USPS drop shipping
- carrier route density and saturation mail guide
- addressing and Move Update requirements guide
- data processing, lettershop and logistics services
- cascade priority data merge case study
- municipal unit-level list reconstruction case study
- political mail printing built on voter data